 |
| Market Cap | 130.68M | EPS (ttm) | -0.77 |
| P/E | - | EPS this Y | 20.67% |
| Forward P/E | - | EPS next Y | 10.92% |
| PEG | - | EPS past 5Y | - |
| P/S | 12.71 | EPS next 5Y | - |
| P/B | 1.29 | EPS Q/Q | -12.85% |
| Dividend | - | Sales Q/Q | - |
| Insider Own | 47.43% | Inst Own | 17.11% |
| Insider Trans | -7.14% | Inst Trans | -2.32% |
| Short Float | 7.80% | Earnings | May 13/a |
| Analyst Recom | 1.00 | Target Price | 1.60 |
| Avg Volume | 505.22K | 52W Range | 0.45 - 2.17 |
|
|
|
|
Hyzon Motors, Inc. operates as a hydrogen mobility company. It engages in designing, developing, and manufacturing both standalone and integrated hydrogen fuel cells and systems as well as purpose-designed hydrogen-powered commercial vehicles. The company was founded in 2020 and is headquartered in Bolingbrook, IL. |
| Insider Trading |
Relationship |
Date |
Transaction |
Cost |
#Shares |
Value ($) |
#Shares Total |
SEC Form 4 |
| HORIZON FUEL CELL TECHNOLOGIES | 10% Owner | May 17 '24 | Sale | 0.55 | 55,257 | 30,391 | 90,124,280 | May 20 10:37 AM | | HORIZON FUEL CELL TECHNOLOGIES | 10% Owner | May 16 '24 | Sale | 0.55 | 197,183 | 108,451 | 90,179,537 | May 20 10:37 AM | | HORIZON FUEL CELL TECHNOLOGIES | 10% Owner | May 15 '24 | Sale | 0.56 | 23,710 | 13,278 | 90,353,010 | May 16 05:10 PM | | HORIZON FUEL CELL TECHNOLOGIES | 10% Owner | May 14 '24 | Sale | 0.57 | 201,500 | 114,855 | 90,376,720 | May 16 05:10 PM | | HORIZON FUEL CELL TECHNOLOGIES | 10% Owner | May 10 '24 | Sale | 0.56 | 60,145 | 33,681 | 90,578,220 | May 13 10:26 AM |
|
|
 |
 |
| Market Cap | 7.65B | EPS (ttm) | 0.08 |
| P/E | 1091.82 | EPS this Y | 11.59% |
| Forward P/E | 64.85 | EPS next Y | 12.69% |
| PEG | - | EPS past 5Y | - |
| P/S | 12.35 | EPS next 5Y | - |
| P/B | 10.02 | EPS Q/Q | 903.28% |
| Dividend | - | Sales Q/Q | 4.14% |
| Insider Own | 32.87% | Inst Own | 68.39% |
| Insider Trans | -4.30% | Inst Trans | -0.40% |
| Short Float | 6.23% | Earnings | May 02/a |
| Analyst Recom | 1.91 | Target Price | 93.57 |
| Avg Volume | 403.56K | 52W Range | 57.59 - 92.92 |
|
|
|
|
Altair Engineering, Inc. engages in the provision of software and cloud solutions for product design & development, high performance cloud computing, and data intelligence. It operates through the following segments: Software and Client Engineering Services. The Software segment includes a portfolio of software products, as well as solvers and optimization technology products, modelling and visualization tools. The Client Engineering Services segment engages in the provision of client engineering services to support customers with long-term, ongoing product design and development expertise. The company was founded by James Ralph Scapa in 1985 and is headquartered in Troy, MI. |
| Insider Trading |
Relationship |
Date |
Transaction |
Cost |
#Shares |
Value ($) |
#Shares Total |
SEC Form 4 |
| GC Investments LLC | 10% Owner | May 17 '24 | Sale | 90.36 | 50,000 | 4,517,986 | 250,000 | May 20 10:18 AM | | Christ George J | 10% Owner | May 17 '24 | Sale | 90.36 | 50,000 | 4,517,986 | 250,000 | May 20 10:19 AM | | Marraccini Jeffrey | See Remarks | May 14 '24 | Option Exercise | 0.00 | 12,000 | 0 | 16,597 | May 15 12:26 PM | | Marraccini Jeffrey | See Remarks | May 14 '24 | Sale | 85.74 | 12,000 | 1,028,837 | 4,597 | May 15 12:26 PM | | Marraccini Jeffrey | See Remarks | May 13 '24 | Sale | 85.77 | 43 | 3,688 | 4,597 | May 15 12:26 PM |
|
|
|
 |
| Market Cap | 108.88B | EPS (ttm) | 22.53 |
| P/E | 11.90 | EPS this Y | -3.86% |
| Forward P/E | 11.32 | EPS next Y | 9.30% |
| PEG | 0.67 | EPS past 5Y | 20.76% |
| P/S | 2.10 | EPS next 5Y | 17.70% |
| P/B | 1.80 | EPS Q/Q | 15.53% |
| Dividend | 1.34% | Sales Q/Q | 15.57% |
| Insider Own | 0.60% | Inst Own | 91.55% |
| Insider Trans | -8.19% | Inst Trans | -0.57% |
| Short Float | 0.68% | Earnings | Apr 23/a |
| Analyst Recom | 2.08 | Target Price | 269.81 |
| Avg Volume | 1.66M | 52W Range | 183.71 - 275.41 |
|
|
|
|
Chubb Ltd. operates as a holding company, which engages in the provision of commercial and personal property and casualty insurance, personal accident and accident and health (A&H), reinsurance, and life insurance. It operates through the following segments: North America Commercial Property and Casualty (P&C) Insurance, North America Personal P&C Insurance, North America Agricultural Insurance, Overseas General Insurance, Global Reinsurance, and Life Insurance. The North America Commercial P&C Insurance segment that includes the business written by Chubb divisions that provide P&C insurance and services to large, middle market and small commercial businesses in the U.S., Canada, and Bermuda. The North America Personal P&C Insurance segment offers affluent and high net worth individuals and families with homeowners, high value automobile and collector cars, valuable articles, personal and excess liability, travel insurance, and recreational marine insurance and services. The North America Agricultural Insurance segment is involved in comprehensive multiple peril crop insurance (MPCI) and crop-hail insurance, and Chubb agribusiness. The Overseas General Insurance segment caters for both commercial and consumer P&C insurance and services in countries and territories outside of North America where the company operates. The Global Reinsurance segment covers reinsurance business. The Life Insurance segment focuses on its international life operations. The company was founded in 1882 and is headquartered in Zurich, Switzerland. |
| Insider Trading |
Relationship |
Date |
Transaction |
Cost |
#Shares |
Value ($) |
#Shares Total |
SEC Form 4 |
| ATIEH MICHAEL G | Director | May 17 '24 | Sale | 269.70 | 716 | 193,105 | 39,295 | May 20 10:01 AM | | HAGAN ANNMARIE T | Chief Accounting Officer | May 16 '24 | Option Exercise | 139.01 | 2,303 | 320,140 | 9,247 | May 17 12:27 PM | | HAGAN ANNMARIE T | Chief Accounting Officer | May 16 '24 | Sale | 263.81 | 1,529 | 403,365 | 7,718 | May 17 12:27 PM | | Keogh John W | President & COO | May 08 '24 | Option Exercise | 114.78 | 34,103 | 3,914,342 | 319,238 | May 09 12:52 PM | | Keogh John W | President & COO | May 08 '24 | Sale | 251.98 | 34,707 | 8,745,426 | 284,136 | May 09 12:52 PM |
|
|
| |
 |
| Market Cap | 32.51B | EPS (ttm) | 35.66 |
| P/E | 42.68 | EPS this Y | 5.70% |
| Forward P/E | 34.06 | EPS next Y | 11.17% |
| PEG | 4.59 | EPS past 5Y | 12.55% |
| P/S | 8.59 | EPS next 5Y | 9.30% |
| P/B | - | EPS Q/Q | -2.69% |
| Dividend | - | Sales Q/Q | -0.30% |
| Insider Own | 1.53% | Inst Own | 97.58% |
| Insider Trans | -2.16% | Inst Trans | -0.86% |
| Short Float | 1.64% | Earnings | May 09/a |
| Analyst Recom | 3.00 | Target Price | 1353.55 |
| Avg Volume | 134.51K | 52W Range | 928.49 - 1535.86 |
|
|
|
May-13-24 11:26AM
|
UBS Adjusts Mettler-Toledo International Price Target to $1,590 From $1,360, Maintains Neutral Rating
(MT Newswires) |
|
10:38AM
|
Don't Overlook Mettler-Toledo (MTD) International Revenue Trends While Assessing the Stock
(Zacks) |
|
09:09AM
|
Baird Adjusts Price Target on Mettler-Toledo International to $1,360 From $1,212, Keeps Neutral Rating
(MT Newswires) |
|
06:30AM
|
Stifel Adjusts Price Target on Mettler-Toledo International to $1,510 From $1,270
(MT Newswires) |
|
03:04AM
|
Mettler-Toledo International Inc (MTD) Q1 2024 Earnings Call Transcript Highlights: Navigating ...
(GuruFocus.com) |
|
May-12-24 09:41AM
|
Mettler-Toledo International Inc. (NYSE:MTD) Q1 2024 Earnings Call Transcript
(Insider Monkey) |
|
May-11-24 01:02AM
|
Decoding Mettler-Toledo International Inc (MTD): A Strategic SWOT Insight
(GuruFocus.com) |
|
May-10-24 08:00PM
|
Mettler-Toledo (MTD) Q1 Earnings: How Key Metrics Compare to Wall Street Estimates
(Zacks) +17.04% |
|
01:25PM
|
Goldman Sachs Raises Price Target on Mettler-Toledo International to $1,150 From $1,125
(MT Newswires) |
|
01:10PM
|
Mettler-Toledo (MTD) Q1 Earnings Top Estimates, Sales Fall Y/Y
(Zacks) |
|
Mettler-Toledo International, Inc. engages in the provision of precision instruments and services. The firm manufactures weighing instruments for use in laboratory, industrial, packaging, logistics, and food retailing applications. It also manufactures several related analytical instruments and provides automated chemistry solutions used in drug and chemical compound discovery and development, metal detection and other end-of-line inspection systems used in production and packaging and provides solutions for use in certain process analytics applications. It operates through the following segments: U.S. Operations, Swiss Operations, Western European Operations, Chinese Operations, and Other. The U.S. Operations segment represents certain of the company's marketing and producing organizations located in the United States. The Swiss Operations segment is involved in the marketing and producing organizations located in Switzerland, as well as extensive research and development operations that are responsible for the development, production, and marketing of precision instruments, including weighing, analytical, and measurement technologies for use in a variety of industrial, and laboratory applications. The Western European Operations segment includes marketing and producing organizations in Western Europe, excluding operations located in Switzerland. The Chinese Operations segment focuses on marketing and producing organizations located in China. The Other segment refers to the operations that exist outside these reportable segments. The company was founded in 1991 and is headquartered in Columbus, OH. |
| Insider Trading |
Relationship |
Date |
Transaction |
Cost |
#Shares |
Value ($) |
#Shares Total |
SEC Form 4 |
| Vadala Shawn | Chief Financial Officer | May 16 '24 | Option Exercise | 397.95 | 300 | 119,385 | 5,214 | May 20 09:19 AM | | Vadala Shawn | Chief Financial Officer | May 16 '24 | Sale | 1528.43 | 300 | 458,528 | 4,914 | May 20 09:19 AM | | Keller Gerry | Head of Process Analytics | May 15 '24 | Option Exercise | 595.31 | 310 | 184,546 | 316 | May 16 08:39 AM | | Keller Gerry | Head of Process Analytics | May 15 '24 | Sale | 1511.56 | 310 | 468,584 | 6 | May 16 08:39 AM | | Vadala Shawn | Chief Financial Officer | May 14 '24 | Option Exercise | 327.20 | 1,730 | 566,060 | 6,644 | May 15 11:39 AM |
|
|
|
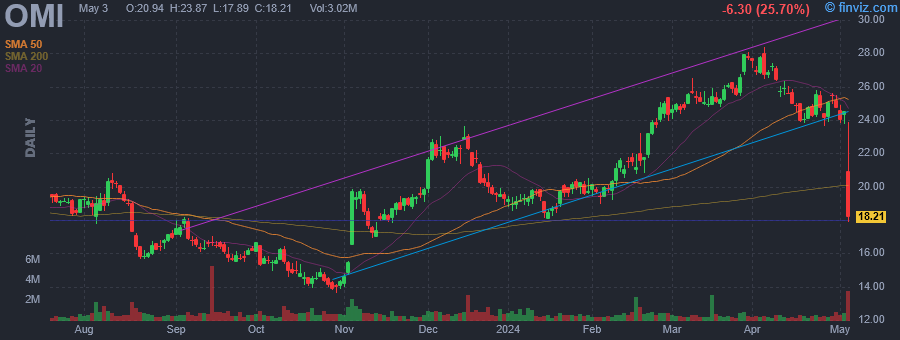 |
| Market Cap | 1.42B | EPS (ttm) | -0.52 |
| P/E | - | EPS this Y | 14.51% |
| Forward P/E | 9.52 | EPS next Y | 24.82% |
| PEG | - | EPS past 5Y | 40.46% |
| P/S | 0.14 | EPS next 5Y | 18.10% |
| P/B | 1.58 | EPS Q/Q | 11.70% |
| Dividend | - | Sales Q/Q | 3.56% |
| Insider Own | 9.73% | Inst Own | 97.12% |
| Insider Trans | -1.13% | Inst Trans | -1.26% |
| Short Float | 8.38% | Earnings | May 03/b |
| Analyst Recom | 3.14 | Target Price | 22.57 |
| Avg Volume | 690.81K | 52W Range | 13.64 - 28.35 |
|
|
|
|
Owens & Minor, Inc. is a healthcare solutions company, which engages in the product manufacturing and delivery, home health supply, and perioperative services to support care through the hospital and into the home. It operates through the Products and Healthcare Services, and Patient Direct segments. The Products and Healthcare Services segment includes medical distribution, the outsourced logistics and value-added services business, and global products, which manufacture and source medical surgical products through the production and kitting operations. The Patient Direct segments includes the home healthcare business, Byram and Apria. The company was founded by Otho O. Owens and G. Gilmer Minor in 1882 and is headquartered in Mechanicsville, VA. |
| Insider Trading |
Relationship |
Date |
Transaction |
Cost |
#Shares |
Value ($) |
#Shares Total |
SEC Form 4 |
| Galloway Heath H | EVP,General Counsel & CorpSecy | May 17 '24 | Sale | 19.06 | 2,052 | 39,111 | 54,846 | May 20 08:11 AM | | Galloway Heath H | EVP,General Counsel & CorpSecy | May 16 '24 | Sale | 20.18 | 2,031 | 40,986 | 56,898 | May 20 08:11 AM | | Bernocchi Perry A | EVP, CEO,. Patient Direct | May 01 '24 | Sale | 24.31 | 24,094 | 585,680 | 170,497 | May 03 04:03 PM | | Leon Jonathan A | SVP, Corporate Treasurer | Apr 22 '24 | Sale | 24.84 | 5,000 | 124,200 | 84,673 | Apr 23 06:00 PM | | Lowry Michael Wayne | SVP, Corporate Controller | Feb 27 '24 | Sale | 25.00 | 10,000 | 250,000 | 71,654 | Feb 28 08:00 PM |
|
|
| |
 |
| Market Cap | 84.11M | EPS (ttm) | -1.30 |
| P/E | - | EPS this Y | 14.58% |
| Forward P/E | - | EPS next Y | 5.37% |
| PEG | - | EPS past 5Y | 30.25% |
| P/S | 100.13 | EPS next 5Y | - |
| P/B | 5.44 | EPS Q/Q | -14.85% |
| Dividend | - | Sales Q/Q | -90.96% |
| Insider Own | 7.93% | Inst Own | 38.96% |
| Insider Trans | -0.86% | Inst Trans | -3.74% |
| Short Float | 15.12% | Earnings | May 09/a |
| Analyst Recom | 1.00 | Target Price | 3.83 |
| Avg Volume | 2.95M | 52W Range | 0.67 - 3.33 |
|
|
|
|
Gritstone bio, Inc. clinical-stage biotechnology company, which engages in developing the next generation of cancer immunotherapies to fight multiple cancer types. The company was founded by Andrew Allen, Timothy Chan, Mark Cobbold, Graham Lord, Naiyer Rizvi and Jean-Charles Soria in August 2015 and is headquartered in Emeryville, CA. |
| Insider Trading |
Relationship |
Date |
Transaction |
Cost |
#Shares |
Value ($) |
#Shares Total |
SEC Form 4 |
| Allen Andrew R | PRESIDENT AND CEO | May 16 '24 | Sale | 0.75 | 24,263 | 18,156 | 985,360 | May 17 09:58 PM | | Jones Erin | EVP, CHIEF OPERATING OFFICER | May 16 '24 | Sale | 0.75 | 13,749 | 10,288 | 359,293 | May 17 09:57 PM | | Jooss Karin | SEE REMARKS | May 16 '24 | Sale | 0.75 | 13,749 | 10,288 | 683,526 | May 17 09:57 PM | | Economides Vassiliki | EVP, CHIEF FINANCIAL OFFICER | May 16 '24 | Sale | 0.75 | 13,749 | 10,288 | 262,437 | May 17 09:55 PM | | Hawryluk Matthew | EVP, CHIEF BUSINESS OFFICER | May 16 '24 | Sale | 0.75 | 9,259 | 6,929 | 313,931 | May 17 09:56 PM |
|
|
|
 |
| Market Cap | 136.26B | EPS (ttm) | 0.64 |
| P/E | 101.78 | EPS this Y | 4.01% |
| Forward P/E | 31.09 | EPS next Y | 131.76% |
| PEG | 2.17 | EPS past 5Y | - |
| P/S | 3.53 | EPS next 5Y | 47.00% |
| P/B | 12.30 | EPS Q/Q | -302.82% |
| Dividend | - | Sales Q/Q | 14.82% |
| Insider Own | 3.93% | Inst Own | 78.94% |
| Insider Trans | -0.67% | Inst Trans | 1.20% |
| Short Float | 2.54% | Earnings | May 08/b |
| Analyst Recom | 1.27 | Target Price | 86.92 |
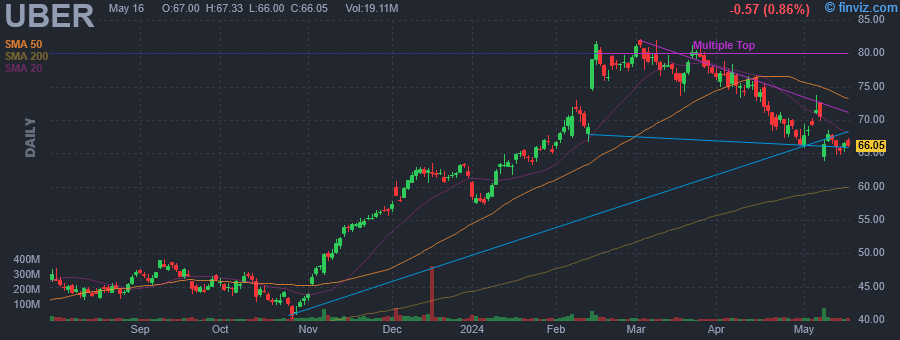
| Avg Volume | 18.28M | 52W Range | 37.07 - 82.14 |
|
|
|
|
Uber Technologies, Inc. is a technology platform, which engages in the development and operation of technology applications, network, and product to power movement from point A to point B. The firm offers ride services and merchants delivery service providers for meal preparation, grocery and other delivery services. It operates through the following segments: Mobility, Delivery, and Freight. The Mobility segment refers to products that connect consumers with Mobility Drivers who provide rides in a variety of vehicles, such as cars, auto rickshaws, motorbikes, minibuses, or taxis. The Delivery segment offers consumers to search for and discover local restaurants, order a meal, and either pick-up at the restaurant or have the meal delivered and, in certain markets, Delivery also includes offerings for grocery, alcohol and convenience store delivery and other goods. The Freight segment leverages proprietary technology, brand awareness, and experience revolutionizing industries to connect carriers with shippers on Uber's platform, and gives carriers upfront, transparent pricing and the ability to book a shipment. The company was founded by Oscar Salazar Gaitan, Travis Kalanick and Garrett Camp in 2009 and is headquartered in San Francisco, CA. |
| Insider Trading |
Relationship |
Date |
Transaction |
Cost |
#Shares |
Value ($) |
#Shares Total |
SEC Form 4 |
| KHOSROWSHAHI DARA | Chief Executive Officer | May 17 '24 | Option Exercise | 33.65 | 1,000,000 | 33,650,000 | 2,156,996 | May 17 09:46 PM | | KHOSROWSHAHI DARA | Chief Executive Officer | May 17 '24 | Sale | 65.93 | 500,000 | 32,964,000 | 1,656,996 | May 17 09:46 PM | | West Tony | See Remarks | May 13 '24 | Sale | 65.63 | 18,750 | 1,230,597 | 206,338 | May 15 05:17 PM | | Hazelbaker Jill | See Remarks | Feb 14 '24 | Sale | 77.83 | 20,000 | 1,556,674 | 107,290 | Feb 16 06:58 PM | | West Tony | See Remarks | Feb 12 '24 | Sale | 70.08 | 18,750 | 1,313,926 | 185,566 | Feb 14 07:31 PM |
|
|
| |
 |
| Market Cap | 13.20B | EPS (ttm) | -3.13 |
| P/E | - | EPS this Y | 34.83% |
| Forward P/E | - | EPS next Y | 51.46% |
| PEG | - | EPS past 5Y | -11.28% |
| P/S | 10.92 | EPS next 5Y | - |
| P/B | 16.55 | EPS Q/Q | 54.33% |
| Dividend | - | Sales Q/Q | 52.11% |
| Insider Own | 6.39% | Inst Own | 95.04% |
| Insider Trans | -15.76% | Inst Trans | 1.75% |
| Short Float | 5.35% | Earnings | May 09/a |
| Analyst Recom | 1.50 | Target Price | 121.11 |
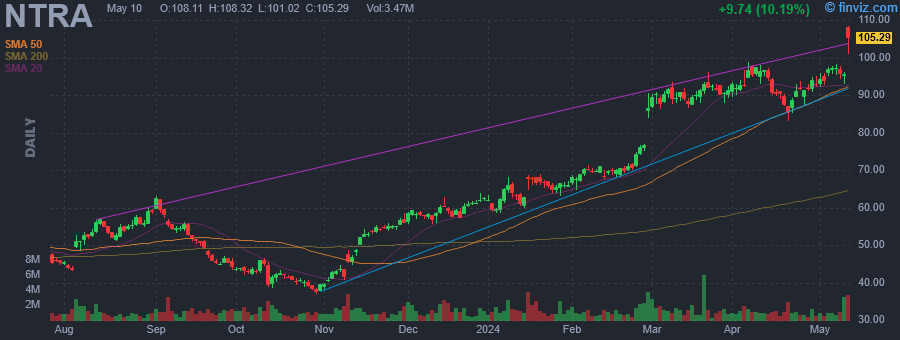
| Avg Volume | 1.44M | 52W Range | 36.90 - 108.75 |
|
|
|
|
Natera, Inc. is a diagnostics company, which engages in the discovery, development, and commercialization of genetic testing services. It provides Panorama non-invasive prenatal test (NIPT), Vistara, horizon carrier screening (HCS), spectrum pre-implantation genetic screening and spectrum pre-implantation genetic diagnosis, Anora products of conception (POC) and non-invasive paternity testing (PAT). The company was founded by Matthew Rabinowitz and Jonathan Sheena in November 2003 and is headquartered in Austin, TX. |
| Insider Trading |
Relationship |
Date |
Transaction |
Cost |
#Shares |
Value ($) |
#Shares Total |
SEC Form 4 |
| Chapman Steven Leonard | CEO AND PRESIDENT | May 15 '24 | Sale | 107.08 | 6,779 | 725,911 | 219,456 | May 17 09:35 PM | | RABINOWITZ DANIEL | SEC. AND CHIEF LEGAL OFFICER | May 10 '24 | Option Exercise | 19.68 | 30,000 | 590,400 | 234,495 | May 10 09:35 PM | | RABINOWITZ DANIEL | SEC. AND CHIEF LEGAL OFFICER | May 10 '24 | Sale | 104.59 | 30,000 | 3,137,567 | 204,495 | May 10 09:35 PM | | Sheena Jonathan | CO-FOUNDER | May 10 '24 | Sale | 105.11 | 2,700 | 283,794 | 319,061 | May 10 09:35 PM | | Rabinowitz Matthew | EXECUTIVE CHAIRMAN | May 08 '24 | Option Exercise | 5.40 | 215,000 | 1,159,990 | 1,290,648 | May 10 09:35 PM |
|
|
|
 |
| Market Cap | 1.34B | EPS (ttm) | 2.58 |
| P/E | 12.83 | EPS this Y | 32.39% |
| Forward P/E | 8.60 | EPS next Y | 26.11% |
| PEG | - | EPS past 5Y | 208.72% |
| P/S | 1.63 | EPS next 5Y | - |
| P/B | 4.24 | EPS Q/Q | 69.63% |
| Dividend | - | Sales Q/Q | 96.47% |
| Insider Own | 55.11% | Inst Own | 15.26% |
| Insider Trans | -9.08% | Inst Trans | 324.24% |
| Short Float | 17.34% | Earnings | May 09/b |
| Analyst Recom | 1.00 | Target Price | 44.00 |
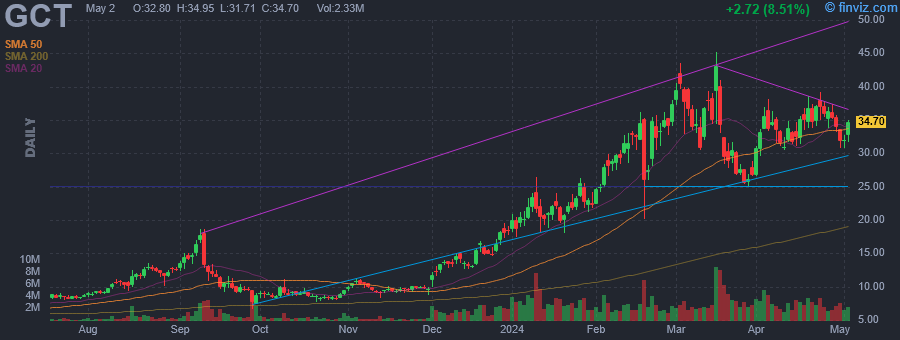
| Avg Volume | 3.06M | 52W Range | 5.25 - 45.18 |
|
|
|
May-18-24 09:00AM
|
7 Great Growth Stocks You Need to Own Before 2025
(InvestorPlace) |
|
May-17-24 03:10AM
|
GigaCloud Technology Insider Sold Shares Worth $8,642,163, According to a Recent SEC Filing
(MT Newswires) |
|
May-16-24 03:06AM
|
GigaCloud Technology Insider Sold Shares Worth $1,033,917, According to a Recent SEC Filing
(MT Newswires) |
|
May-15-24 08:00AM
|
3 Stocks That Can Turn $1,000 into $10,000 Faster Than You Think
(InvestorPlace) -5.71% |
|
03:10AM
|
GigaCloud Technology Insider Sold Shares Worth $12,700,553, According to a Recent SEC Filing
(MT Newswires) |
|
May-14-24 09:00AM
|
GigaCloud Technology Inc. (GCT) Is a Trending Stock: Facts to Know Before Betting on It
(Zacks) |
|
03:21AM
|
GigaCloud Technology Insider Sold Shares Worth $9,029,704, According to a Recent SEC Filing
(MT Newswires) |
|
May-13-24 06:00AM
|
Triple Your Money: 3 Stocks with Potential for a 300% Increase by 2025
(InvestorPlace) |
|
May-12-24 08:56AM
|
3 Game-Changing Stocks to Unlock Life-Changing Wealth
(InvestorPlace) |
|
May-11-24 05:09AM
|
Is Gigacloud Stock an Excellent Investment?
(Motley Fool) |
|
GigaCloud Technology, Inc. specializes in global end-to-end business-to-business (B2B) electronic commerce (e-commerce) for large parcel merchandise. The firm's B2B ecommerce platform, which it refers to as the GigaCloud Marketplace, integrates everything from product discovery, payments, and messaging portals, leveraging channel diversification for suppliers, while resellers gain access to thousands of products backed by a complete logistics package. Its global marketplace seamlessly connects manufacturers, primarily in Asia, with resellers, primarily in the U.S., Asia, and Europe, to execute cross-border transactions with confidence, speed, and efficiency. The firm offers a comprehensive solution that transports products from the manufacturer's warehouse to the end customer's doorstep, all in one place. The company was founded by Lei Wu on August 29, 2006 and is headquartered in El Monte, CA. |
| Insider Trading |
Relationship |
Date |
Transaction |
Cost |
#Shares |
Value ($) |
#Shares Total |
SEC Form 4 |
| Wu Lei | Chief Executive Officer | May 16 '24 | Sale | 36.06 | 14,188 | 511,680 | 114,190 | May 17 09:25 PM | | Lin Frank Hurst | Director | May 15 '24 | Sale | 36.82 | 141,938 | 5,225,621 | 5,435,065 | May 16 09:00 PM | | Wu Lei | Chief Executive Officer | May 15 '24 | Sale | 35.41 | 14,188 | 502,364 | 128,378 | May 17 09:25 PM | | Lin Frank Hurst | Director | May 14 '24 | Sale | 36.78 | 92,886 | 3,416,542 | 5,577,003 | May 16 09:00 PM | | Hao Xinyan | Chief Operating Officer | May 14 '24 | Sale | 37.07 | 67,455 | 2,500,732 | 787,486 | May 14 09:52 PM |
|
|
|
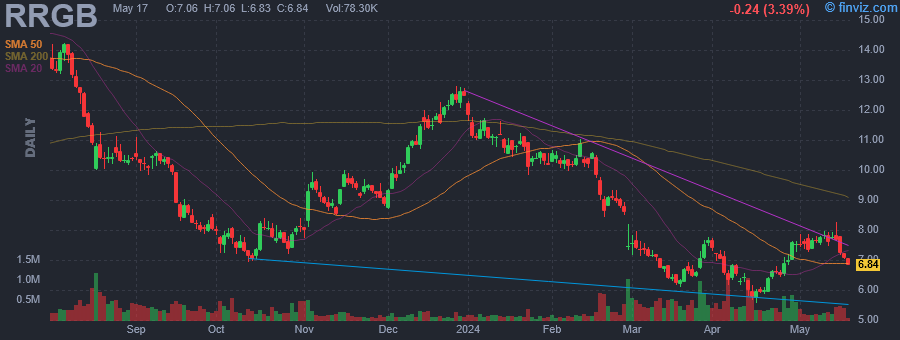 |
| Market Cap | 108.47M | EPS (ttm) | -1.34 |
| P/E | - | EPS this Y | -11.39% |
| Forward P/E | - | EPS next Y | 65.34% |
| PEG | - | EPS past 5Y | -22.07% |
| P/S | 0.08 | EPS next 5Y | 10.00% |
| P/B | - | EPS Q/Q | 68.70% |
| Dividend | - | Sales Q/Q | 6.53% |
| Insider Own | 4.27% | Inst Own | 72.66% |
| Insider Trans | -32.47% | Inst Trans | -13.33% |
| Short Float | 22.32% | Earnings | May 29/a |
| Analyst Recom | 1.80 | Target Price | 15.25 |
| Avg Volume | 417.04K | 52W Range | 5.56 - 16.50 |
|
|
|
|
Red Robin Gourmet Burgers, Inc. develops, operates, and franchises full-service restaurants North America. It serves a variety of salads, soups, appetizers, other entrees, desserts, signature alcoholic and non-alcoholic beverages. The company was founded in September 1969 and is headquartered in Englewood, CO. |
| Insider Trading |
Relationship |
Date |
Transaction |
Cost |
#Shares |
Value ($) |
#Shares Total |
SEC Form 4 |
| Archon Capital Management LLC | 10% Owner | May 17 '24 | Sale | 6.85 | 100,200 | 686,495 | 1,551,587 | May 17 09:15 PM | | Archon Capital Management LLC | 10% Owner | May 16 '24 | Sale | 7.09 | 141,905 | 1,005,794 | 1,651,787 | May 17 09:15 PM | | Archon Capital Management LLC | 10% Owner | May 15 '24 | Sale | 7.36 | 77,000 | 566,512 | 1,793,692 | May 17 09:15 PM | | Archon Capital Management LLC | 10% Owner | Oct 04 '23 | Buy | 7.57 | 6,000 | 45,420 | 1,870,692 | Oct 05 04:47 PM | | Archon Capital Management LLC | 10% Owner | Oct 03 '23 | Buy | 7.43 | 50,000 | 371,500 | 1,864,692 | Oct 05 04:47 PM |
|
|
|
